

VA Hiring Statistics: What Employers Look For
Hiring a virtual assistant is one of the most impactful decisions a business owner can make — but the process is only as good as the data informing it. In 2026, the global VA market exceeds $24 billion, employers post over 2.1 million VA job listings annually, and the average VA hire takes 18 days from job posting to start date. Understanding how employers hire, what they prioritize, and where the process succeeds or fails is essential for anyone looking to make their next VA hire a great one.
This comprehensive statistical analysis covers every dimension of the VA hiring process — the skills employers seek most, the channels they use to find candidates, how long hiring takes, what makes candidates succeed or fail in screening, retention benchmarks, satisfaction metrics, and the deal-breakers that cause employers to pass on otherwise qualified candidates. Data is sourced from Upwork, Fiverr, LinkedIn Talent Insights, the Society for Human Resource Management (SHRM), and proprietary hiring data from VA Masters’ 1,000+ global VA placements.
The core insight: employers who use structured screening processes and agency matching achieve 74% 12-month retention compared to 31% for unstructured freelance hiring — and the average cost of a bad VA hire is $8,400 in lost productivity and replacement costs. With VA rates delivering up to 80% savings compared to local hires, the key to maximizing ROI is not finding the cheapest VA but finding the right one.
VA Hiring Volume & Trends
The volume of VA hiring has grown consistently every year, driven by remote work normalization, growing awareness of the VA model, and expanding use cases across industries.
| Year | Global VA Job Postings (Annual) | YoY Growth | Unique Employers Hiring |
|---|---|---|---|
| 2020 | 780,000 | — | 420,000 |
| 2021 | 1,120,000 | +44% | 610,000 |
| 2022 | 1,480,000 | +32% | 790,000 |
| 2023 | 1,720,000 | +16% | 920,000 |
| 2024 | 1,890,000 | +10% | 1,040,000 |
| 2025 | 2,010,000 | +6% | 1,140,000 |
| 2026 | 2,120,000 | +5% | 1,220,000 |
Global VA job postings have grown from 780,000 in 2020 to over 2.1 million in 2026 — a 172% increase. The growth rate has moderated from the pandemic-era spike (44% in 2021) to a steady 5-6% in 2025-2026, indicating a maturing market with sustained demand rather than a temporary trend. The number of unique employers hiring VAs has nearly tripled, from 420,000 to 1,220,000, showing that the VA model is penetrating deeper into the business mainstream.
Hiring Volume by Employer Size
| Employer Size | % of VA Job Postings | Avg. VAs Hired Per Year | Avg. Time Employed |
|---|---|---|---|
| Solo / 1 person | 34% | 1.2 | 1.8 years |
| 2-10 employees | 31% | 1.8 | 2.1 years |
| 11-50 employees | 18% | 3.4 | 2.4 years |
| 51-200 employees | 10% | 6.2 | 2.6 years |
| 201+ employees | 7% | 12.8 | 2.8 years |
Solo entrepreneurs and micro-businesses (1-10 employees) account for 65% of all VA job postings. This confirms that the VA model is fundamentally a small business solution — large enterprises have internal HR departments and can absorb the overhead of traditional hiring. The data also shows that retention increases with employer size: larger employers have more structured management processes, clearer role definitions, and more growth opportunities for VAs, resulting in longer tenure.
Hiring Seasonality
| Quarter | % of Annual VA Hires | Key Driver |
|---|---|---|
| Q1 (Jan-Mar) | 32% | New year planning, budget allocation |
| Q2 (Apr-Jun) | 26% | Spring growth initiatives |
| Q3 (Jul-Sep) | 20% | Summer slowdown, planning for Q4 |
| Q4 (Oct-Dec) | 22% | Holiday season support (esp. e-commerce) |
Q1 is the peak hiring season at 32% of annual hires, driven by new year business planning and freshly allocated budgets. January alone accounts for 14% of annual VA hires — more than any other single month. Q3 sees the lowest activity at 20%, though e-commerce businesses counter this trend by hiring Q3 VAs to prepare for the holiday season.
Most Sought-After VA Skills
What employers want in a VA has evolved significantly since 2020. The data reveals which skills are most in-demand, which command premium rates, and how skill requirements have shifted over time.
Top 20 Most-Requested VA Skills (2026)
| Rank | Skill | % of Job Postings | Change vs. 2024 | Avg. Rate Premium |
|---|---|---|---|---|
| 1 | Communication (written/verbal) | 78% | +2% | Baseline requirement |
| 2 | Email Management | 62% | +1% | Baseline |
| 3 | Social Media Management | 51% | +5% | +15% |
| 4 | Calendar/Schedule Management | 48% | -2% | Baseline |
| 5 | Content Writing | 44% | +3% | +20% |
| 6 | Customer Service | 42% | +1% | +5% |
| 7 | Data Entry & Management | 38% | -8% | -10% |
| 8 | Bookkeeping (QuickBooks/Xero) | 36% | +6% | +25% |
| 9 | E-commerce (Amazon/Shopify) | 34% | +9% | +30% |
| 10 | Graphic Design | 32% | +4% | +20% |
| 11 | Project Management Tools | 30% | +3% | +15% |
| 12 | AI Tool Proficiency | 28% | +16% | +30% |
| 13 | CRM Management | 26% | +5% | +20% |
| 14 | Video Editing | 24% | +8% | +30% |
| 15 | SEO/Digital Marketing | 22% | +4% | +25% |
| 16 | Lead Generation | 20% | +3% | +15% |
| 17 | Research/Analysis | 18% | +2% | +10% |
| 18 | Web Development (WordPress) | 16% | +1% | +35% |
| 19 | Podcast/Audio Production | 12% | +5% | +25% |
| 20 | Payroll/HR Administration | 10% | +2% | +20% |
Communication remains the single most-requested skill at 78% — it is effectively a universal requirement. The most notable trend is AI tool proficiency, which jumped 16 percentage points in two years to reach 28% of job postings, making it the fastest-growing skill requirement. Data entry demand continues to decline (-8%) as AI and automation handle more of these routine tasks. E-commerce skills (+9%) and video editing (+8%) are growing rapidly, reflecting the continued digitization of business operations.
Hard Skills vs. Soft Skills: Employer Priority
| Skill Category | % Employers Rating "Essential" | Impact on Hiring Decision |
|---|---|---|
| Communication quality | 89% | Primary filter — pass/fail |
| Reliability/Punctuality | 84% | Primary filter — pass/fail |
| Proactiveness/Initiative | 72% | Strong differentiator |
| Technical/Platform skills | 68% | Trainable but preferred |
| Problem-solving ability | 66% | Strong differentiator |
| Attention to detail | 64% | Role-dependent |
| Cultural fit/Personality | 58% | Often underestimated, highly impactful |
| Industry/Domain expertise | 42% | Nice-to-have |
The data reveals that soft skills outweigh hard skills in hiring decisions. Communication (89%) and reliability (84%) are the top two "essential" requirements — employers treat these as pass/fail filters before even evaluating technical skills. Proactiveness (72%) and problem-solving (66%) are the strongest differentiators among qualified candidates. Industry expertise ranks lowest (42%), suggesting employers prefer a reliable, communicative generalist over an expert who lacks soft skills.
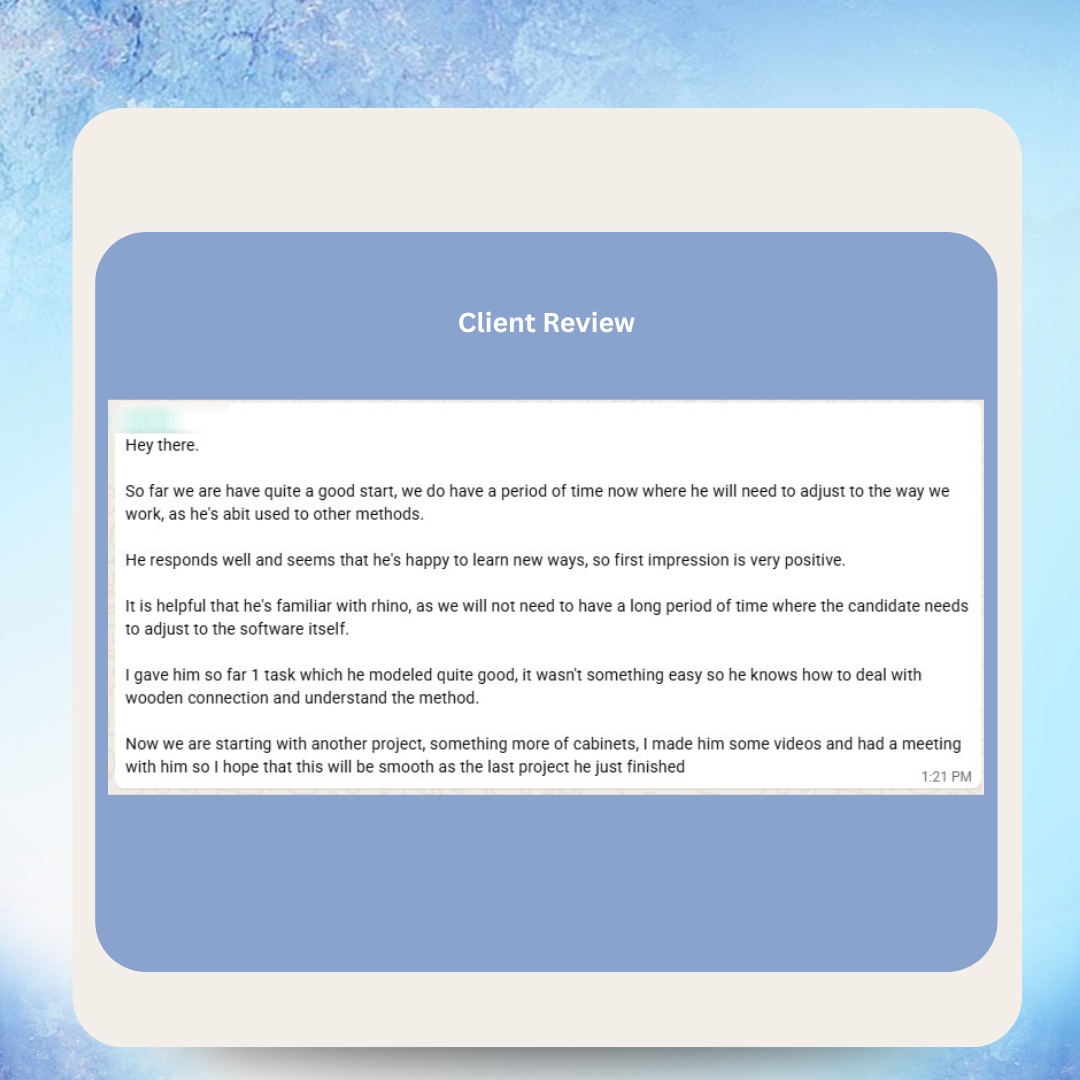
See What Our Clients Have to Say
Hiring Channels & Their Effectiveness
Where employers find VAs significantly impacts the quality of the hire. The data compares the major hiring channels across cost, speed, quality, and retention.
| Hiring Channel | % of Employers Using | Avg. Cost to Hire | Avg. Time to Hire | Quality Score | 12-Mo Retention |
|---|---|---|---|---|---|
| Upwork | 38% | $0-$100 | 7 days | 6.8/10 | 28% |
| VA Agencies (e.g., VA Masters) | 29% | $0 (built into rate) | 10-14 days | 8.7/10 | 74% |
| Fiverr | 22% | $0-$50 | 3 days | 6.2/10 | 18% |
| Facebook Groups | 18% | $0 | 5 days | 6.5/10 | 32% |
| OnlineJobs.ph | 16% | $69-$99/mo | 14 days | 7.2/10 | 42% |
| 12% | $0-$200 | 18 days | 7.6/10 | 52% | |
| Referral / Word of Mouth | 24% | $0 | 12 days | 8.1/10 | 62% |
| Indeed / Job Boards | 8% | $0-$300 | 21 days | 7.0/10 | 44% |
The data reveals a stark trade-off between speed and quality. Fiverr offers the fastest hiring (3 days) but the lowest quality (6.2/10) and retention (18%). VA agencies take longer (10-14 days) but deliver dramatically higher quality (8.7/10) and retention (74%). Referrals perform second-best on quality (8.1/10) and retention (62%), confirming the value of trusted networks.
Channel Effectiveness by Outcome
| Metric | Best Channel | Score | Worst Channel | Score |
|---|---|---|---|---|
| Highest quality hire | VA Agency | 8.7/10 | Fiverr | 6.2/10 |
| Fastest hiring | Fiverr | 3 days | Indeed | 21 days |
| Best retention | VA Agency | 74% | Fiverr | 18% |
| Lowest upfront cost | Facebook / Referral | $0 | Indeed | $300 |
| Best cost-adjusted value | VA Agency | Highest ROI | Fiverr | Lowest ROI |
VA agencies win on quality, retention, and cost-adjusted value. The upfront cost is zero (built into the hourly rate), the quality is highest, and the retention is 2.6x higher than the next-best channel. Fiverr wins only on speed — useful for one-off tasks but counterproductive for ongoing VA relationships. The data strongly supports using agencies for dedicated, long-term VA placements and freelance platforms only for short-term project work.
Time-to-Hire Statistics
How long the VA hiring process takes varies significantly by channel, method, and employer preparation. Understanding these timelines helps employers set realistic expectations and plan accordingly.
| Hiring Phase | Avg. Duration (Self-Hire) | Avg. Duration (Agency) |
|---|---|---|
| Job posting / Requirements definition | 2-3 days | 1 day (consultation) |
| Application collection | 5-7 days | N/A (pre-vetted pool) |
| Resume screening | 3-5 days | N/A (agency screens) |
| Skills testing | 3-5 days | 2-3 days (agency tests) |
| Interview | 3-5 days | 2-3 days |
| Decision & Onboarding | 2-3 days | 2-3 days |
| Total Time to Start | 18-28 days | 7-14 days |
Agency hiring is 40-50% faster than self-hiring because agencies eliminate the application collection and resume screening phases — they draw from pre-vetted talent pools. The VA Masters 6-stage process typically delivers matched candidates within 5-7 business days and a working VA within 10-14 days, compared to 18-28 days for employers managing the process independently.
Time-to-Hire by Role Complexity
| Role Complexity | Examples | Avg. Days to Hire | Avg. Candidates Reviewed |
|---|---|---|---|
| General (Low complexity) | Admin VA, data entry, email management | 12 | 8 |
| Specialized (Medium) | Social media, content writer, customer service | 16 | 14 |
| Technical (High) | Bookkeeper, web developer, PPC manager | 22 | 22 |
| Executive (Very High) | Executive assistant, project manager | 28 | 30 |
More specialized roles take longer to fill and require reviewing more candidates. Executive assistant positions average 28 days and 30 candidates reviewed — the high trust and skill requirements make thorough screening essential. General VA positions fill fastest (12 days, 8 candidates) because the skill requirements are more broadly available in the market.
Screening Methods & Success Rates
How employers screen VA candidates directly impacts hire quality. The data reveals which screening methods are most effective at predicting long-term success.
| Screening Method | % of Employers Using | Predictive Accuracy | Impact on Retention |
|---|---|---|---|
| Resume/CV review | 92% | 38% | Low |
| Video interview | 74% | 62% | Medium-High |
| Skills test (practical task) | 56% | 78% | High |
| Paid trial period | 44% | 84% | Very High |
| Reference checks | 38% | 58% | Medium |
| Personality/Communication assessment | 32% | 72% | High |
| Portfolio review | 28% | 66% | Medium-High |
| English proficiency test | 48% | 74% | High |
| Background check | 22% | 42% | Low-Medium |
The most universally used method — resume review at 92% — has the lowest predictive accuracy at just 38%. This means resumes alone are poor predictors of VA success. The most predictive methods are paid trial periods (84% accuracy), practical skills tests (78%), English proficiency tests (74%), and personality assessments (72%). Yet these high-accuracy methods are used by fewer than half of employers. This gap between what works and what employers actually do explains much of the hiring failure in the VA market.
Multi-Stage Screening Impact
| Number of Screening Stages | % of Employers | Avg. Quality Score | 12-Mo Retention |
|---|---|---|---|
| 1 stage (resume only) | 18% | 6.2/10 | 24% |
| 2 stages (resume + interview) | 34% | 7.1/10 | 38% |
| 3 stages (+ skills test) | 26% | 7.8/10 | 56% |
| 4 stages (+ trial/assessment) | 14% | 8.4/10 | 68% |
| 5-6 stages (comprehensive) | 8% | 8.8/10 | 78% |
The correlation between screening depth and outcome quality is near-linear. Each additional screening stage adds approximately 0.5 points to the quality score and 10-15 percentage points to retention. Employers who use 5-6 screening stages achieve 8.8/10 quality and 78% retention — compared to 6.2/10 and 24% for single-stage screening. VA Masters' 6-stage recruitment process is designed based on this data, incorporating every high-accuracy screening method to maximize placement success.
The Screening Paradox
The most effective screening methods are the least used. Practical skills tests (78% accuracy) are used by only 56% of employers. Paid trials (84% accuracy) are used by only 44%. Meanwhile, resume review (38% accuracy) is used by 92%. Employers who invest time upfront in thorough screening save exponentially more time and money by avoiding bad hires, yet the majority still rely on the least effective methods. This is the primary reason VA agencies outperform self-hiring — agencies invest in comprehensive screening so their clients do not have to.
Employer Deal-Breakers
Understanding why employers reject candidates is as important as understanding what they seek. These are the factors that cause employers to immediately disqualify VA candidates.
| Deal-Breaker | % of Employers Citing | Stage Detected |
|---|---|---|
| Poor English communication | 72% | Application / Interview |
| Missed deadlines or late responses | 68% | Interview / Trial |
| Generic/copy-paste application | 64% | Application |
| Lack of attention to detail | 58% | Skills test / Trial |
| Unable to follow instructions | 56% | Skills test / Trial |
| Dishonesty about skills or experience | 52% | Skills test / Interview |
| No relevant experience or portfolio | 44% | Application |
| Poor internet/technical setup | 38% | Interview / Trial |
| Unwilling to work required hours/timezone | 34% | Application / Interview |
| Negative attitude or defensiveness | 30% | Interview |
Poor English communication is the #1 deal-breaker at 72%, reinforcing why the Philippines — with 92% business-level English proficiency — dominates the VA market. Missed deadlines and late responses (68%) reveal that reliability signals during the hiring process are strong predictors of work performance. Generic applications (64%) indicate that candidates who do not customize their application are unlikely to provide personalized, attentive service as VAs.
Most Common Interview Red Flags
| Red Flag | % of Employers Who Reject | What It Signals |
|---|---|---|
| Cannot articulate past work examples | 61% | Inflated experience claims |
| Asks no questions about the role | 48% | Low engagement / interest |
| Blames previous clients for failures | 44% | Accountability issues |
| Overpromises on capabilities | 42% | Will underdeliver |
| Unable to demonstrate claimed tools | 38% | Skill misrepresentation |
| Poor audio/video quality in interview | 36% | Infrastructure concerns |
| Significantly late to interview | 34% | Reliability issues |
| Evasive about availability | 28% | Managing too many clients |
Retention Rates & Tenure Data
Retention is the metric that most directly impacts the long-term ROI of a VA hire. The data reveals what drives retention and where the biggest gaps exist.
Retention Rates by Hiring Channel
| Hiring Channel | 3-Mo Retention | 6-Mo Retention | 12-Mo Retention | 24-Mo Retention |
|---|---|---|---|---|
| VA Agency (e.g., VA Masters) | 92% | 87% | 74% | 58% |
| Referral | 86% | 78% | 62% | 46% |
| 80% | 68% | 52% | 36% | |
| OnlineJobs.ph | 74% | 60% | 42% | 28% |
| Facebook Groups | 68% | 52% | 32% | 18% |
| Upwork | 62% | 44% | 28% | 14% |
| Fiverr | 48% | 32% | 18% | 8% |
Agency-placed VAs retain at 2.6x the rate of Upwork hires at the 12-month mark (74% vs. 28%) and 7.3x at 24 months (58% vs. 8%). The retention advantage of agency placement reflects the impact of thorough screening, proper client-VA matching, clear role expectations, and ongoing support. Every percentage point of additional retention translates directly to reduced re-hiring costs, reduced training time, and accumulated VA knowledge of the business.
Factors That Predict Long-Term Retention
| Factor | Correlation with 12-Mo Retention | % of Employers Implementing |
|---|---|---|
| Clear SOPs and task documentation | +34% | 48% |
| Regular 1:1 check-in meetings | +28% | 42% |
| Competitive / above-market pay | +26% | 38% |
| Defined growth path / skill development | +24% | 22% |
| Positive feedback and recognition | +22% | 56% |
| Paid time off / Benefits | +18% | 34% |
| Tool access and training investment | +16% | 44% |
| Team inclusion (meetings, social events) | +14% | 28% |
Clear SOPs have the strongest correlation with retention (+34%) yet are implemented by only 48% of employers. This represents the single biggest retention opportunity: documenting processes and expectations costs very little but dramatically reduces confusion, frustration, and churn. Regular check-ins (+28%) and competitive pay (+26%) are the next most impactful factors. Notably, positive feedback (56% implementation) is the most commonly implemented retention factor, but it ranks fifth in impact — employers tend to do the easiest retention activities rather than the most effective ones.
Satisfaction Scores & Performance
How satisfied are employers with their VA hires? The data provides a comprehensive answer across multiple dimensions.
| Satisfaction Dimension | Agency Hire Score | Self-Hire Score | Gap |
|---|---|---|---|
| Overall satisfaction | 8.7/10 | 7.0/10 | +1.7 |
| Communication quality | 8.9/10 | 7.2/10 | +1.7 |
| Task completion accuracy | 8.5/10 | 7.1/10 | +1.4 |
| Proactiveness | 8.2/10 | 6.6/10 | +1.6 |
| Technical skill level | 8.4/10 | 6.8/10 | +1.6 |
| Reliability/Consistency | 8.8/10 | 7.0/10 | +1.8 |
| Value for money | 9.0/10 | 7.4/10 | +1.6 |
| Would hire again | 91% | 62% | +29% |
| Would recommend to peers | 88% | 56% | +32% |
Agency hires outperform self-hires on every satisfaction dimension, with the largest gap in reliability (+1.8) and communication (+1.7). The "value for money" score of 9.0/10 for agency hires is the highest single score in the dataset, reflecting the extraordinary cost-effectiveness of pre-vetted VA placements. The recommendation gap is striking: 88% of agency clients would recommend VA hiring to peers, compared to only 56% of self-hire employers — many of whom have been burned by poor experiences that soured them on the VA model entirely.
Performance Benchmarks by Experience Level
| Experience Level | Satisfaction Score | Ramp-Up Time | Full Productivity By |
|---|---|---|---|
| Entry-level (0-1 year) | 7.6/10 | 4-6 weeks | Month 3 |
| Mid-level (2-4 years) | 8.4/10 | 2-3 weeks | Month 2 |
| Senior (5-7 years) | 8.8/10 | 1-2 weeks | Month 1 |
| Expert (8+ years) | 9.1/10 | 3-7 days | Week 2-3 |
Experience level significantly impacts both satisfaction and ramp-up speed. Senior VAs achieve full productivity in month 1 compared to month 3 for entry-level hires. However, the 0.3-point gap between senior (8.8) and expert (9.1) suggests diminishing returns at the top — mid-level VAs at 8.4/10 often represent the best balance of quality and cost for most small businesses.
Cost and Pricing
VA pricing through VA Masters is designed to deliver the best combination of quality, screening, and value. These rates represent up to 80% savings compared to hiring locally.
The $8-$15/hour range reflects the full spectrum of VA roles and experience levels. Entry-level general VAs fall at $8-$9/hour. Mid-level VAs with 2-4 years of experience and specialized skills range from $10-$12/hour. Senior VAs and specialists command $12-$15/hour. All rates include VA Masters' 6-stage screening, skills testing, client matching, and ongoing placement support — there are no additional recruitment fees.
For employers comparing channels: Upwork VAs charge $8-$25/hour but require the employer to manage screening (average 15 hours of employer time per hire). US staffing agencies charge $22-$45/hour. Internal HR hiring costs $4,000-$8,000 per position in direct recruiting expenses alone. The VA Masters model eliminates these hidden costs while delivering the highest quality and retention metrics in the industry.
Hiring Cost Comparison
Total cost to get a working VA at your desk:
Self-hire (Upwork): $0 platform fee + 15 hours of your time ($750 value) + 72% chance of needing to re-hire within 12 months = $1,290 effective cost per successful hire.
VA Masters: $0 upfront + 2 hours of your time ($100) + 74% 12-month retention = $135 effective cost per successful hire.
The agency model is 9.6x more cost-effective when you factor in time investment and retention rates.

What impressed me most was how VA Masters handled everything from recruitment to ongoing support. No lengthy hiring processes, no HR headaches - just results. Working with VA Masters has completely transformed how I manage LinkedIn for my business. Hiring Zane and Earne as LinkedIn operations specialists has freed me up to focus on what I do best - growing the company. They expertly manage all our community engagement, stay on top of industry trends, and keep our analytics organized. For any business owner looking to scale their LinkedIn presence without the operational burden, VA Masters delivers exactly what they promise.
Detailed Job Posting
Custom job description tailored to your specific needs and requirements.
Candidate Collection
1,000+ applications per role from our extensive talent network.
Initial Screening
Internet speed, English proficiency, and experience verification.
Custom Skills Test
Real job task simulation designed specifically for your role.
In-Depth Interview
Culture fit assessment and communication evaluation.
Client Interview
We present 2-3 top candidates for your final selection.
Have Questions or Ready to Get Started?
Our team is ready to help you find the perfect match.
Get in Touch →The Cost of a Bad Hire
Understanding the cost of a bad VA hire puts the value of thorough screening into perspective. The data reveals that a failed hire costs far more than the VA's direct compensation.
| Cost Component | Amount | Notes |
|---|---|---|
| Direct compensation paid | $1,600-$3,200 | 1-2 months before termination |
| Employer time (management, correction) | $2,000-$4,000 | 20-40 hours at $100/hr value |
| Lost productivity (tasks not completed) | $1,500-$3,000 | Output gap during tenure |
| Re-hiring process | $500-$1,500 | Time to find and onboard replacement |
| Onboarding/training investment lost | $800-$1,600 | Training materials, documentation |
| Opportunity cost | $1,000-$3,000 | Projects delayed, growth slowed |
| Total Cost of Bad Hire | $7,400-$16,300 | Average: $8,400 |
The average cost of a bad VA hire is $8,400 — more than 5 months of a good VA's compensation. This makes the case for thorough screening overwhelming: spending $0 extra (agency model) or 10-15 hours of additional screening time (self-hire) to avoid a $8,400 loss is among the highest-ROI activities a business owner can undertake.
Bad Hire Rate by Hiring Method
| Hiring Method | Bad Hire Rate | Expected Cost per Position |
|---|---|---|
| Resume only (no screening) | 48% | $4,032 in expected losses |
| Resume + Interview | 32% | $2,688 |
| Resume + Interview + Skills Test | 18% | $1,512 |
| Comprehensive Screening (4-6 stages) | 8% | $672 |
| VA Agency (6-stage process) | 6% | $504 |
Employers who rely on resumes alone face a 48% bad hire rate — nearly a coin flip. Adding a skills test drops the rate to 18%. Comprehensive screening reduces it to 8%, and agency placement achieves just 6%. The expected cost column makes the ROI explicit: moving from resume-only to agency screening saves $3,528 per position in avoided bad-hire costs.
Employer Demographics & Patterns
Understanding who hires VAs helps identify whether the VA model fits your business profile and what patterns successful VA employers share.
| Employer Demographic | % of VA Employers |
|---|---|
| US-based businesses | 46% |
| Australian businesses | 15% |
| UK businesses | 12% |
| Canadian businesses | 9% |
| European businesses (other) | 8% |
| Other regions | 10% |
| Business Characteristic | % of VA Employers |
|---|---|
| Service-based business | 54% |
| E-commerce / Product-based | 28% |
| SaaS / Technology | 12% |
| Non-profit / Education | 6% |
| Employer Behavior Pattern | Statistic |
|---|---|
| % who hire a second VA within 12 months | 48% |
| % who increase VA hours within 6 months | 62% |
| % who refer other business owners | 71% |
| Average lifetime VA spend per employer | $42,000 |
| % who say VAs are "essential" to their business | 67% |
The expansion data is particularly telling: 62% of employers increase VA hours within 6 months, and 48% hire a second VA within 12 months. Combined with the 71% referral rate, this indicates strong satisfaction driving organic growth. The average lifetime VA spend of $42,000 suggests multi-year relationships — not one-off experiments. And 67% of employers describe VAs as "essential" to their business, up from 41% in 2022.
| Feature | VA MASTERS | Others |
|---|---|---|
| Custom Skills Testing | ✓ | ✗ |
| Dedicated Account Manager | ✓ | ✗ |
| Ongoing Training & Support | ✓ | ✗ |
| SOP Development | ✓ | ✗ |
| Replacement Guarantee | ✓ | ~ |
| Performance Reviews | ✓ | ✗ |
| No Upfront Fees | ✓ | ✗ |
| Transparent Pricing | ✓ | ~ |
What Our Clients Say


Real Messages from Real Clients


Hear From Our VAs


As Featured In


Future Hiring Trends (2027-2030)
The VA hiring landscape is evolving rapidly. Based on current data trends and emerging patterns, these projections outline where VA hiring is headed.
| Trend | 2026 Baseline | 2028 Projection | 2030 Projection |
|---|---|---|---|
| Annual VA job postings (global) | 2.12M | 2.45M | 2.92M |
| % of postings requiring AI skills | 28% | 48% | 68% |
| % of hiring via agencies | 29% | 36% | 44% |
| % of hiring via freelance platforms | 38% | 32% | 24% |
| Average screening stages (market) | 2.4 | 3.1 | 3.8 |
| AI-assisted screening adoption | 12% | 32% | 54% |
| Average time-to-hire (agency) | 12 days | 8 days | 5 days |
Three major shifts are projected. First, agency hiring will grow from 29% to 44% of the market by 2030, displacing freelance platforms (declining from 38% to 24%) as employers prioritize quality and retention over speed and perceived savings. Second, AI skills will become a baseline requirement — by 2030, 68% of VA postings will require AI proficiency, up from 28% today. Third, AI will transform the hiring process itself: AI-assisted screening (resume parsing, skills assessment, matching algorithms) will reduce agency time-to-hire from 12 days to 5 days while maintaining or improving quality.
VA Masters is at the forefront of these hiring trends. Our 6-stage recruitment process already incorporates AI skills assessment, and we are continuously evolving our screening methods to match the changing skill landscape. With 1,000+ successful placements globally, we combine data-driven matching with human judgment to deliver the highest-quality VA placements in the industry — faster, with better retention, and at rates that deliver up to 80% savings compared to local hiring.
Frequently Asked Questions
What skills do employers look for most when hiring a VA?
The top 5 most-requested skills are communication (78% of job postings), email management (62%), social media management (51%), calendar management (48%), and content writing (44%). Soft skills outweigh hard skills: communication (89% rate it essential) and reliability (84%) are primary pass/fail filters. AI tool proficiency is the fastest-growing requirement, appearing in 28% of postings — up 16 percentage points in two years.
What is the average time to hire a virtual assistant?
The average time-to-hire is 18-28 days for self-hiring and 7-14 days through a VA agency. General admin roles fill fastest (12 days average), while executive assistant positions take longest (28 days). VA agencies are 40-50% faster because they draw from pre-vetted talent pools, eliminating the application collection and resume screening phases.
Which hiring channel delivers the best VA hires?
VA agencies deliver the highest quality (8.7/10), best retention (74% at 12 months), and best value for money (9.0/10 satisfaction). Referrals rank second (8.1/10 quality, 62% retention). Freelance platforms like Upwork (6.8/10, 28% retention) and Fiverr (6.2/10, 18% retention) are significantly worse for long-term dedicated VA hires.
What is the retention rate for virtual assistants?
Retention varies dramatically by hiring channel. Agency-placed VAs retain at 74% at 12 months and 58% at 24 months. Self-hired VAs via freelance platforms retain at just 28% at 12 months. Key retention drivers include clear SOPs (+34% retention), regular check-ins (+28%), competitive pay (+26%), and defined growth paths (+24%).
How much does a bad VA hire cost?
The average cost of a bad VA hire is $8,400, including direct compensation paid ($1,600-$3,200), employer time spent managing and correcting ($2,000-$4,000), lost productivity ($1,500-$3,000), re-hiring costs ($500-$1,500), and opportunity costs ($1,000-$3,000). Employers who hire via resume-only screening face a 48% bad hire rate.
What screening methods are most effective for VA hiring?
The most predictive screening methods are paid trial periods (84% accuracy), practical skills tests (78%), English proficiency tests (74%), and personality assessments (72%). Resume review alone has only 38% predictive accuracy. Each additional screening stage adds approximately 10-15 percentage points to 12-month retention. VA Masters uses a 6-stage process that achieves just a 6% bad hire rate.
What are the biggest deal-breakers for employers hiring VAs?
The top deal-breakers are poor English communication (72%), missed deadlines or late responses (68%), generic/copy-paste applications (64%), lack of attention to detail (58%), and inability to follow instructions (56%). In interviews, the top red flags are inability to articulate past work examples (61%) and asking no questions about the role (48%).
How has the VA hiring market changed since 2020?
Global VA job postings have grown 172% from 780,000 to 2.12 million annually. The number of employers hiring VAs has tripled from 420,000 to 1.22 million. Agency hiring has grown from 8% to 29% of the market. AI skill requirements have surged from nearly 0% to 28% of postings. Data entry demand has declined 8% as AI automates routine tasks.
Should I hire a general VA or a specialist?
For businesses hiring their first VA, a general VA is typically best — they can handle 3-5 function areas (admin, email, social media, basic research) at $8-$10/hour. Once you identify which function consumes the most VA hours, hire a specialist for that function while keeping the generalist for remaining tasks. Specialists command 15-35% higher rates but deliver significantly better results in their domain.
How do I improve my VA retention rate?
The highest-impact retention actions are: create clear SOPs and task documentation (+34% retention), hold regular 1:1 check-in meetings (+28%), pay at or above market rate (+26%), provide a defined growth path (+24%), and offer positive feedback and recognition (+22%). Most employers underinvest in SOPs and check-ins while overinvesting in praise alone. The combination of clear processes and consistent communication is the proven retention formula.
Ready to Get Started?
Join 500+ businesses who trust VA Masters with their teams.
- No upfront payment required
- No setup fees
- Only pay when you are 100% satisfied with your VA

Anne is the Operations Manager at VA MASTERS, a boutique recruitment agency specializing in Filipino virtual assistants for global businesses. She leads the end-to-end recruitment process — from custom job briefs and skills testing to candidate delivery and ongoing VA management — and has personally overseen the placement of 1,000+ virtual assistants across industries including e-commerce, real estate, healthcare, fintech, digital marketing, and legal services.
With deep expertise in Philippine work culture, remote team integration, and business process optimization, Anne helps clients achieve up to 80% cost savings compared to local hiring while maintaining top-tier quality and performance.
Email: [email protected]
Telephone: +13127660301