

The State of Outsourcing: Key Data and Insights for 2026 — Market Size, Adoption Rates, and Trend Analysis
$971 billion. That is the projected global outsourcing market size for 2026, according to Grand View Research — up from $261 billion in 2022. The outsourcing industry is not just growing; it is undergoing a structural transformation driven by remote work normalization, AI integration, talent shortages in developed markets, and the persistent reality that businesses in North America and Europe cannot fill skilled roles fast enough or affordably enough to compete. What was once a cost-cutting strategy for Fortune 500 companies has become a survival mechanism for businesses of every size.
But the headline number tells only a fraction of the story. Where is this growth concentrated? Which functions are being outsourced most aggressively? How do adoption rates differ between SMBs and enterprises? What are businesses actually saving — and where are the hidden costs that eat into projected savings? Which countries are gaining market share and which are losing it? This article compiles the most current, credible data on the global outsourcing market into a single reference. Every statistic is sourced from recognized research firms, industry surveys, and public filings. Every data table is designed to be immediately useful for business leaders making outsourcing decisions in 2026.
VA Masters operates at the intersection of these trends. With 1,000+ virtual assistant placements connecting businesses worldwide with pre-vetted Filipino professionals, we see the data play out in real engagements every day. The Philippines remains the dominant destination for English-language outsourcing — and the data explains why. Let us walk through what the numbers say, what they mean, and how they should inform your outsourcing strategy.
Global Outsourcing Market Size and Growth
The global outsourcing market has experienced consistent growth over the past decade, accelerating sharply after 2020 when the COVID-19 pandemic forced businesses to adopt remote work models at scale. That forced adoption removed the primary psychological barrier to outsourcing -- the discomfort of managing people you cannot see -- and permanently expanded the addressable market for outsourcing services.
| Year | Global Market Size (USD) | YoY Growth | Key Driver |
|---|---|---|---|
| 2019 | $232.4 billion | 4.8% | Digital transformation demand |
| 2020 | $245.9 billion | 5.8% | COVID-19 remote work acceleration |
| 2021 | $261.9 billion | 6.5% | Hybrid work normalization |
| 2022 | $280.6 billion | 7.1% | Talent shortage in developed markets |
| 2023 | $304.2 billion | 8.4% | AI integration and cost pressures |
| 2024 | $336.1 billion | 10.5% | SMB adoption surge |
| 2025 | $380.7 billion | 13.3% | AI-augmented service delivery |
| 2026 (projected) | $430-$450 billion* | 13-18% | Platform economy and VA market expansion |
*Note: Projections vary by research firm. Statista estimates $430B for core BPO; Grand View Research's $971B figure includes IT outsourcing, which represents the largest segment. The BPO segment alone (non-IT) is projected at $430-$450B.
Market Size by Segment
The outsourcing market splits into two primary segments: IT outsourcing (ITO) and business process outsourcing (BPO). IT outsourcing remains the larger segment by revenue, but BPO is growing faster as businesses outsource an expanding range of non-IT functions.
| Segment | 2024 Market Size | 2026 Projected | CAGR (2024-2028) |
|---|---|---|---|
| IT Outsourcing (ITO) | $512.5 billion | $610-$650 billion | 11.2% |
| Business Process Outsourcing (BPO) | $336.1 billion | $430-$450 billion | 14.6% |
| Knowledge Process Outsourcing (KPO) | $73.4 billion | $98-$105 billion | 16.8% |
| Virtual Assistant Services | $19.6 billion | $28-$32 billion | 22.4% |
The virtual assistant services segment is the fastest-growing subsegment of BPO, driven by SMB adoption and the platform economy that makes hiring a dedicated VA accessible to businesses of every size. This is the segment where VA Masters operates, and our own growth reflects the broader market trend -- demand for pre-vetted Filipino VAs has grown approximately 40% year-over-year since 2023.
Outsourcing Adoption Rates by Business Size
Outsourcing is no longer an enterprise-only strategy. The most dramatic adoption growth is among small and mid-sized businesses, which now represent the majority of new outsourcing buyers.
| Business Size | Employees | Outsourcing Adoption Rate (2024) | Change vs. 2021 | Avg Functions Outsourced |
|---|---|---|---|---|
| Micro business | 1-10 | 34% | +18 pts | 1.2 |
| Small business | 11-50 | 52% | +21 pts | 2.1 |
| Mid-market | 51-500 | 67% | +14 pts | 3.4 |
| Upper mid-market | 501-5,000 | 78% | +8 pts | 4.7 |
| Enterprise | 5,000+ | 89% | +3 pts | 6.2 |
The data reveals a clear pattern: enterprise adoption is mature (89% with only 3 percentage points of growth), while small business adoption is accelerating rapidly (+21 points in three years). The primary driver is accessibility -- platforms and agencies like VA Masters have reduced the minimum viable outsourcing engagement from a $50,000+ annual BPO contract to a single VA at $1,120 per month. This democratization of outsourcing is the defining trend of the current market.
First-Time Outsourcing Buyers
In 2024, approximately 1.2 million businesses outsourced for the first time globally -- the highest number ever recorded. Of these first-time buyers, 73% were businesses with fewer than 50 employees. The most common first outsourced function was administrative support (38%), followed by customer service (22%) and bookkeeping (17%). This aligns with VA Masters' experience: most new clients start with a single administrative or customer service VA before expanding to additional roles.
The Tipping Point
Research from Clutch.co shows that businesses cross the outsourcing tipping point when the founder or CEO spends more than 15 hours per week on tasks outside their core competency. For solopreneurs and small teams, this threshold is typically reached at $300,000 to $500,000 in annual revenue. At that stage, the cost of a dedicated VA ($1,120-$1,760/month) is far less than the opportunity cost of the founder's time spent on administrative work.
Most Outsourced Business Functions
Not all business functions are outsourced at the same rate. The following data shows which functions businesses outsource most frequently and how the rankings have shifted over the past three years.
| Rank | Function | % of Businesses Outsourcing | Rank Change (2021-2024) | Avg Cost Saving |
|---|---|---|---|---|
| 1 | IT services and support | 54% | -- | 40-60% |
| 2 | Customer service | 47% | Up 2 | 50-70% |
| 3 | Accounting and finance | 43% | Up 1 | 45-65% |
| 4 | Administrative support | 41% | Up 3 | 60-80% |
| 5 | Digital marketing | 38% | Up 2 | 50-70% |
| 6 | HR and recruitment | 34% | -- | 40-60% |
| 7 | Web and app development | 31% | Down 3 | 45-65% |
| 8 | E-commerce operations | 28% | Up 4 | 55-75% |
| 9 | Content creation | 26% | Up 1 | 50-70% |
| 10 | Data entry and processing | 24% | Down 2 | 65-80% |
The biggest movers are administrative support (up 3 positions) and e-commerce operations (up 4 positions). Administrative support's rise reflects the VA market expansion -- dedicated virtual assistants have made admin outsourcing accessible to businesses that previously could not afford or access BPO services. E-commerce operations' surge reflects the growth of online retail and the operational complexity of managing multi-channel e-commerce businesses. VA Masters has seen particularly strong demand in both categories -- see our guides on e-commerce operations outsourcing and customer service outsourcing for function-specific data.
Function-Specific Growth Rates
While IT outsourcing remains the largest segment by volume, several functions are growing at significantly faster rates:
| Function | 2024 Growth Rate | 5-Year CAGR | Growth Driver |
|---|---|---|---|
| AI and ML services | 34% | 28.5% | Enterprise AI adoption |
| E-commerce operations | 24% | 19.2% | Online retail expansion |
| Virtual assistant services | 22% | 18.7% | SMB accessibility |
| Digital marketing | 18% | 15.3% | Multi-channel complexity |
| Customer success | 16% | 14.1% | SaaS growth |
| Cybersecurity | 15% | 13.8% | Threat landscape expansion |
| Content creation | 14% | 12.4% | Content marketing demand |
| Bookkeeping and accounting | 12% | 10.6% | Compliance complexity |
Cost Savings Data and Analysis
Cost reduction remains the primary motivator for outsourcing, cited by 70% of businesses as their top reason. But the data shows that actual savings vary significantly based on the function outsourced, the destination country, and the engagement model.
Average Cost Savings by Function
| Function | US In-House Cost (Annual) | Philippines Outsourced (Annual) | Savings % | Net Annual Savings |
|---|---|---|---|---|
| Administrative assistant | $45,000-$55,000 | $13,440-$21,120 | Up to 80% | $24,000-$42,000 |
| Customer service rep | $38,000-$48,000 | $13,440-$19,200 | 55-72% | $19,000-$35,000 |
| Bookkeeper | $50,000-$65,000 | $15,360-$26,880 | 55-69% | $23,000-$50,000 |
| Digital marketing specialist | $55,000-$75,000 | $15,360-$24,960 | 65-72% | $30,000-$50,000 |
| Web developer | $70,000-$100,000 | $19,200-$28,800 | 70-73% | $41,000-$71,000 |
| E-commerce manager | $50,000-$70,000 | $15,360-$23,040 | 65-69% | $27,000-$47,000 |
| Executive assistant | $55,000-$75,000 | $17,280-$24,960 | 65-69% | $30,000-$50,000 |
US in-house costs include salary only. Total employer cost (benefits, payroll taxes, office space, equipment) adds 25-40% to salary, making outsourced savings even higher.
Hidden Costs That Reduce Savings
The data shows that businesses typically achieve 60% to 85% of their projected savings. The gap is explained by costs that are often underestimated during the outsourcing business case:
| Hidden Cost Category | Typical Impact | How to Minimize |
|---|---|---|
| Management overhead | 5-15% of outsourced cost | SOPs and async communication reduce management time by 60% |
| Ramp-up period | 2-8 weeks at reduced productivity | Structured onboarding cuts ramp time by 40% |
| Tool and software licenses | $50-$300/month per worker | Use existing licenses; choose tools with flexible seat pricing |
| Quality assurance | 3-8% of outsourced cost | Build QA into SOPs; spot-check rather than review everything |
| Communication tools | $20-$50/month per worker | Consolidate on existing platforms (Slack, Teams) |
| Turnover and re-hiring | 2-4 weeks disruption per occurrence | Partner with agencies like VA Masters that pre-vet and offer replacements |
Even accounting for these hidden costs, outsourcing to the Philippines delivers net savings of 50% to 75% for most functions. The key is building these costs into your business case upfront rather than being surprised by them after you have committed. For a detailed ROI calculation framework, see our ROI analysis with real numbers.
Regional and Country Trends
The outsourcing destination landscape is evolving. While traditional powerhouses like India and the Philippines remain dominant, new destinations are gaining share and established destinations are moving up the value chain.
Top Outsourcing Destinations by Revenue
| Rank | Country | 2024 BPO Revenue | Primary Strengths | Avg Hourly Rate Range |
|---|---|---|---|---|
| 1 | India | $194 billion | IT, software development, engineering | $10-$30 |
| 2 | Philippines | $38.9 billion | Voice, customer service, admin, English fluency | $7-$15 |
| 3 | Poland | $22.1 billion | IT, finance, nearshore for Europe | $20-$45 |
| 4 | Mexico | $18.7 billion | Nearshore for US, bilingual, same time zones | $12-$25 |
| 5 | Brazil | $14.3 billion | IT, creative services, Portuguese-speaking markets | $12-$22 |
| 6 | Vietnam | $11.2 billion | Software development, manufacturing support | $8-$18 |
| 7 | Colombia | $8.9 billion | Nearshore for US, bilingual, customer service | $10-$20 |
| 8 | Romania | $7.6 billion | IT, multilingual support for Europe | $15-$35 |
| 9 | South Africa | $6.8 billion | English-speaking, finance, customer service | $8-$18 |
| 10 | Ukraine | $5.4 billion | IT and software development | $15-$40 |
Destination Selection Factors
The data shows that businesses select outsourcing destinations based on a hierarchy of factors. Cost is the most cited factor (70%), but it is not the most important one in practice. Language proficiency (cited by 62% but ranked as the deciding factor by the largest group) often trumps a 10% to 20% cost advantage from a cheaper destination. Cultural alignment, time zone overlap, and workforce quality follow. For more on how the Philippines compares to Latin American alternatives, see our head-to-head comparison.
| Selection Factor | % Citing as Important | % Citing as #1 Factor |
|---|---|---|
| Cost savings | 70% | 31% |
| English language proficiency | 62% | 24% |
| Workforce quality and education | 58% | 18% |
| Cultural compatibility | 51% | 12% |
| Time zone alignment | 47% | 8% |
| Political and economic stability | 39% | 4% |
| Data security and IP protection | 36% | 3% |
Philippines Outsourcing by the Numbers
The Philippines is the world's second-largest outsourcing destination and the dominant market for English-language voice and administrative services. The BPO sector is the country's largest private employer and a cornerstone of the national economy.
Key Philippines BPO Statistics
| Metric | 2024 Data | 2021 Comparison | Change |
|---|---|---|---|
| Total BPO revenue | $38.9 billion | $29.1 billion | +33.7% |
| BPO workforce | 1.82 million | 1.44 million | +26.4% |
| Share of GDP | 8.7% | 7.5% | +1.2 pts |
| Number of BPO firms | 1,100+ | 850+ | +29.4% |
| Average annual salary (BPO) | $7,200-$12,000 | $6,000-$9,500 | +20% avg |
| College graduation rate | 500,000+/year | 480,000+/year | +4.2% |
| English proficiency ranking | #2 in Asia (EF EPI) | #2 in Asia | Stable |
| Internet penetration | 73% | 68% | +5 pts |
Why the Philippines Dominates English-Language Outsourcing
The Philippines' dominance in English-language BPO is not accidental. It is the product of several structural advantages that have compounded over decades:
- English proficiency: English is an official language. Filipino professionals speak, write, and comprehend English at near-native levels. The EF English Proficiency Index ranks the Philippines #2 in Asia, behind only Singapore.
- American cultural affinity: Decades of American cultural influence through media, education, and historical ties mean Filipino professionals understand American business norms, communication styles, and cultural references intuitively.
- Education pipeline: Over 500,000 college graduates per year, many with degrees in business administration, accounting, IT, and nursing -- producing a deep talent pool across multiple outsourcing functions.
- Cost structure: The average Filipino BPO salary of $7,200 to $12,000 per year delivers up to 80% savings versus equivalent US roles while providing a competitive middle-class income in the Philippines.
- Government support: The Philippine Economic Zone Authority (PEZA) provides tax incentives for BPO firms, and the government has designated the BPO sector as a national priority for development.
- Proven track record: With 1.82 million BPO workers and $38.9 billion in revenue, the Philippines has the infrastructure, management talent, and institutional experience to deliver outsourcing at scale.
VA Masters specializes in the Philippines for all of these reasons. Our 1,000+ placements have reinforced what the data shows: Filipino VAs consistently deliver high-quality work, strong English communication, cultural alignment with Western business practices, and exceptional value at $7 to $15 per hour. The combination of quality and cost makes the Philippines the optimal destination for the vast majority of English-language outsourcing needs.
AI and Automation Impact on Outsourcing
AI is not replacing outsourcing -- it is transforming it. The data shows that AI adoption is increasing demand for outsourced services, not decreasing it, as businesses need human professionals to implement, manage, and complement AI tools.
AI Impact on Outsourcing Demand
| AI Impact Category | % of Outsourcing Buyers Reporting | Net Effect on Outsourced Headcount |
|---|---|---|
| AI increased our outsourcing needs | 41% | +15-25% more outsourced roles |
| AI had no effect on outsourcing | 34% | Neutral |
| AI reduced some outsourced roles | 19% | -10-20% in specific functions |
| AI significantly reduced outsourcing | 6% | -30%+ (mostly data entry) |
The net effect is positive: 41% of businesses report that AI increased their outsourcing needs, while only 25% report any reduction. The explanation is straightforward -- AI tools create new work categories (prompt engineering, AI output review, AI training data preparation, AI-assisted customer service management) while automating some existing categories (basic data entry, simple template-based tasks). Businesses that integrate AI effectively need more outsourced support to manage the expanded operational footprint, not less.
Functions Most and Least Affected by AI
| Function | AI Impact Level | Effect on Outsourcing |
|---|---|---|
| Basic data entry | High disruption | Volume declining 15-25% annually as OCR and automation improve |
| Simple customer queries | Moderate disruption | Chatbots handle tier-0; human agents focus on complex issues |
| Content creation (basic) | Moderate disruption | AI drafts increase; human editing and strategy roles growing |
| Executive assistance | Low disruption | AI tools augment productivity; human judgment still essential |
| Bookkeeping | Moderate augmentation | AI automates categorization; accountants focus on analysis |
| Digital marketing | Strong augmentation | AI tools increase marketer output; more strategy roles needed |
| E-commerce operations | Moderate augmentation | AI improves listing optimization; operations complexity grows |
| Project management | Low disruption | AI assists scheduling; human coordination remains essential |
The pattern is clear: AI disrupts simple, repetitive tasks but augments complex, judgment-dependent functions. This shifts outsourcing demand toward higher-skilled roles -- a trend that benefits destinations like the Philippines with deep pools of educated, English-speaking talent.
Outsourcing Adoption by Industry
Outsourcing adoption varies significantly by industry, reflecting different operational structures, regulatory environments, and competitive pressures.
| Industry | Adoption Rate | Avg Spend (% of OpEx) | Most Outsourced Functions |
|---|---|---|---|
| Technology / SaaS | 82% | 18-25% | Customer support, QA, content, dev ops |
| Financial services | 76% | 15-22% | Back-office processing, compliance, analytics |
| Healthcare | 71% | 12-18% | Medical billing, transcription, admin |
| E-commerce / retail | 69% | 14-20% | Customer service, fulfillment ops, listing management |
| Real estate | 64% | 10-16% | Lead management, admin, transaction coordination |
| Professional services | 61% | 8-14% | Admin, bookkeeping, marketing |
| Manufacturing | 58% | 10-15% | Supply chain, procurement, data management |
| Education | 47% | 6-10% | Admin, student services, content development |
| Non-profit | 39% | 5-8% | Admin, donor management, communications |
Technology and SaaS companies lead adoption at 82%, driven by their comfort with remote work, high operational tempo, and the cost pressure of scaling customer support alongside rapid user growth. Financial services follow at 76%, though regulatory requirements concentrate outsourcing in non-regulated functions. Healthcare adoption at 71% is notable given the industry's traditionally conservative approach to outsourcing -- the shift reflects growing acceptance of HIPAA-compliant offshore operations for non-clinical functions.
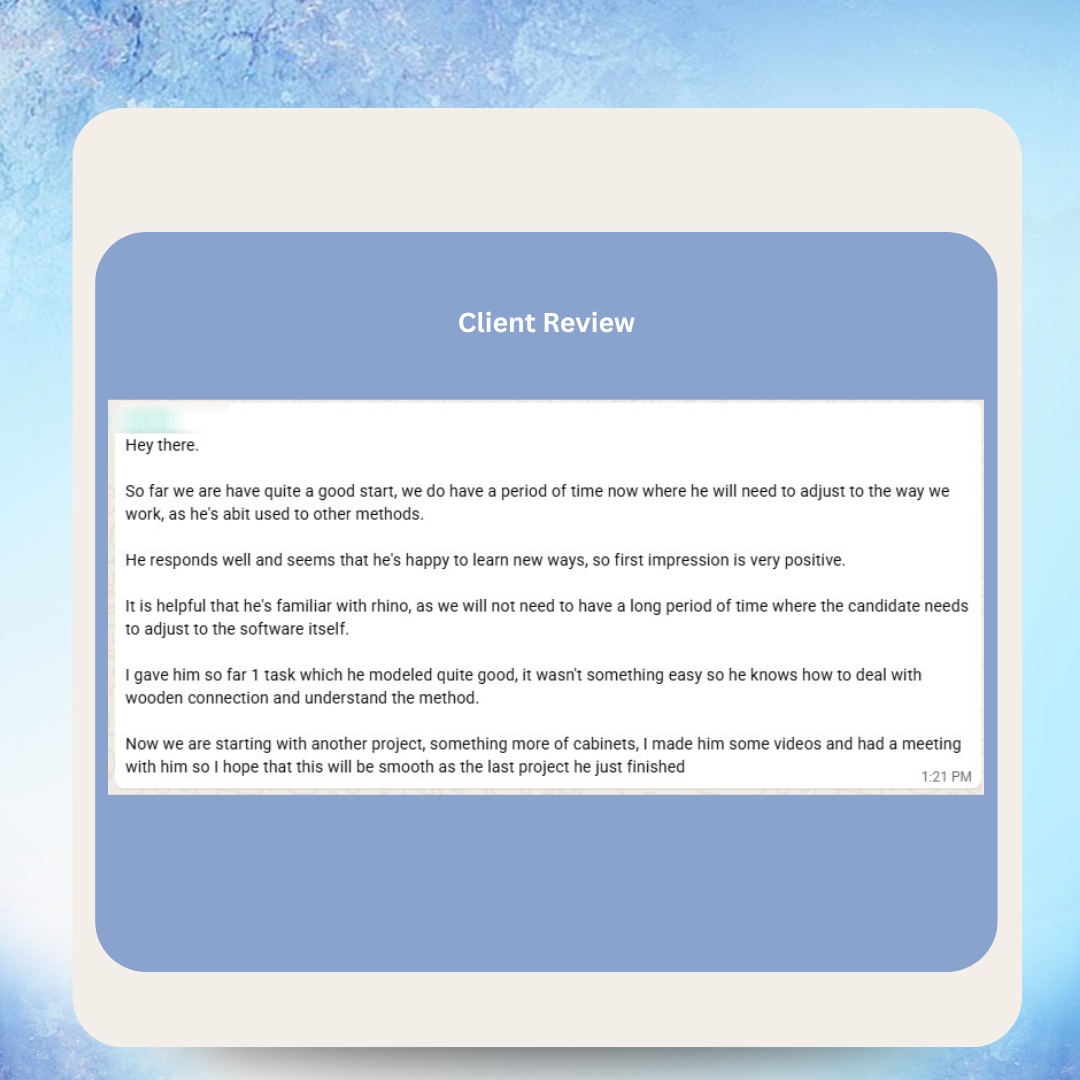
See What Our Clients Have to Say
Current Outsourcing Pricing by Role and Region
Understanding current market pricing is essential for budgeting and benchmarking your outsourcing spend. Here is how VA Masters pricing compares across roles and against alternative destinations.
VA Masters Pricing vs. Market Alternatives
| Role | VA Masters (Philippines) | US-Based VA | India BPO | LatAm Nearshore |
|---|---|---|---|---|
| Administrative assistant | $7-$11/hr | $20-$35/hr | $6-$10/hr | $10-$18/hr |
| Customer service rep | $7-$10/hr | $18-$30/hr | $5-$9/hr | $8-$15/hr |
| Bookkeeper | $8-$14/hr | $25-$45/hr | $7-$12/hr | $12-$22/hr |
| Digital marketing | $8-$13/hr | $30-$60/hr | $8-$15/hr | $12-$25/hr |
| Web developer | $10-$15/hr | $50-$100/hr | $10-$25/hr | $18-$40/hr |
| Executive assistant | $9-$13/hr | $25-$45/hr | $7-$12/hr | $12-$20/hr |
The Philippines (through VA Masters) consistently offers the best value-to-quality ratio for English-language services. India offers lower rates for some roles but with significant English accent and cultural alignment trade-offs for customer-facing positions. Latin American nearshore options offer time zone advantages but at 40% to 80% higher rates. US-based VAs offer proximity and cultural alignment but at 3x to 5x the cost. For a comprehensive pricing breakdown across functions, see our outsourcing cost by function guide.

Before working with VA Masters, our agency relied solely on local employees. Since partnering with them, we’ve embraced outsourcing, which has opened up new opportunities for scaling and saved us tens of percent in operational costs. Bringing in virtual assistants for campaign management, data analysis, and even a personal assistant has allowed us to grow faster without compromising on quality. Having all the HR aspects handled seamlessly means I can focus on strategic growth without getting bogged down by admin tasks. It’s reassuring to know there’s always support to keep the team productive and engaged. If you’re looking to scale efficiently and cost-effectively, I highly recommend them.
Future Projections and Emerging Trends
The outsourcing industry's trajectory is shaped by several converging trends that will define the market through 2030.
Five-Year Market Projections
| Metric | 2026 | 2028 | 2030 |
|---|---|---|---|
| Global BPO market size | $430-$450B | $550-$600B | $700-$780B |
| VA services market | $28-$32B | $42-$48B | $60-$70B |
| Philippines BPO revenue | $44-$48B | $55-$62B | $68-$78B |
| Philippines BPO workforce | 2.0-2.1M | 2.3-2.5M | 2.6-2.9M |
| SMB outsourcing adoption | 55-60% | 65-70% | 72-78% |
| AI-augmented outsourced roles | 25-30% | 45-55% | 65-75% |
Trend 1: AI Augmentation Becomes Standard
By 2028, the majority of outsourced roles will involve AI tool proficiency as a core competency. Virtual assistants will routinely use AI for drafting emails, creating content, analyzing data, and automating workflows. This does not reduce the need for outsourced professionals -- it amplifies their productivity. A single AI-augmented VA in 2028 will deliver the output that required 1.5 to 2 VAs in 2024. Businesses that invest in AI training for their outsourced teams today will have a significant competitive advantage.
Trend 2: Outcome-Based Pricing Grows
Hourly and monthly pricing models will remain dominant for VA engagements, but outcome-based pricing is gaining traction in larger BPO contracts. By 2028, an estimated 25% to 30% of BPO contracts will include some form of outcome-based compensation (up from approximately 12% in 2024). This trend aligns provider incentives with business results and reflects growing sophistication in how businesses measure outsourcing value.
Trend 3: Micro-Outsourcing Expands
The minimum viable outsourcing engagement continues to shrink. Platforms enabling 5- to 10-hour-per-week VA engagements are making outsourcing accessible to solopreneurs, freelancers, and side businesses that would never engage a traditional BPO provider. This micro-outsourcing segment is projected to be the fastest-growing category through 2030, expanding the total addressable market for VA services by an estimated 3x to 4x from current levels.
Trend 4: Skills-Based Hiring Replaces Role-Based Hiring
Businesses increasingly hire outsourced professionals for specific skill combinations rather than traditional job titles. Instead of hiring a "virtual assistant," businesses hire a professional with specific competencies in Salesforce, Canva, bookkeeping, and customer service. This skills-based approach produces better matches and higher satisfaction. VA Masters' recruitment process already emphasizes skills matching -- our testing evaluates specific competencies rather than generic aptitude, which is why our placement success rate exceeds the industry average.
Trend 5: Compliance and Data Security Become Differentiators
As outsourcing becomes standard business practice, data security and regulatory compliance are emerging as key differentiators among providers. Businesses increasingly require SOC 2 compliance, GDPR adherence, HIPAA compatibility, and documented security practices from their outsourcing partners. Providers that invest in compliance infrastructure will command premium positioning, while those that cannot demonstrate adequate security practices will lose market share. This trend favors established agencies like VA Masters that implement structured security protocols over informal freelance arrangements.
Detailed Job Posting
Custom job description tailored to your specific needs and requirements.
Candidate Collection
1,000+ applications per role from our extensive talent network.
Initial Screening
Internet speed, English proficiency, and experience verification.
Custom Skills Test
Real job task simulation designed specifically for your role.
In-Depth Interview
Culture fit assessment and communication evaluation.
Client Interview
We present 2-3 top candidates for your final selection.
Have Questions or Ready to Get Started?
Our team is ready to help you find the perfect match.
Get in Touch →| Feature | VA MASTERS | Others |
|---|---|---|
| Custom Skills Testing | ✓ | ✗ |
| Dedicated Account Manager | ✓ | ✗ |
| Ongoing Training & Support | ✓ | ✗ |
| SOP Development | ✓ | ✗ |
| Replacement Guarantee | ✓ | ~ |
| Performance Reviews | ✓ | ✗ |
| No Upfront Fees | ✓ | ✗ |
| Transparent Pricing | ✓ | ~ |
What Our Clients Say


Real Messages from Real Clients


Hear From Our VAs


As Featured In


Frequently Asked Questions
How big is the global outsourcing market in 2026?
The global BPO market is projected at $430-$450 billion in 2026, with total outsourcing (including IT) approaching $971 billion according to Grand View Research. The market has grown at a 10-13% CAGR since 2022, driven by remote work normalization, AI integration, and SMB adoption.
What percentage of businesses outsource in 2026?
Adoption varies by size: 89% of enterprises (5,000+ employees), 67% of mid-market companies (51-500 employees), and 52% of small businesses (11-50 employees) outsource at least one function. SMB adoption is the fastest-growing segment, up 21 percentage points since 2021.
What are the most commonly outsourced business functions?
IT services (54%), customer service (47%), accounting and finance (43%), administrative support (41%), and digital marketing (38%) are the top five. Administrative support and e-commerce operations are the fastest-rising functions, reflecting VA market expansion and online retail growth.
How much do businesses save by outsourcing to the Philippines?
Average savings range from 50% to 80% depending on the function. Administrative roles see up to 80% savings ($7-$11/hr vs $20-$35/hr US). Accounting saves 55-69%. Web development saves 70-73%. Total employer cost savings are even higher when benefits, taxes, and office costs are included.
Is AI replacing outsourced workers?
No. Data shows 41% of businesses report AI increased their outsourcing needs, while only 25% report any reduction. AI automates simple repetitive tasks but creates new roles in AI management, quality review, and strategy. The net effect on outsourced headcount is positive.
Why is the Philippines the top destination for English-language outsourcing?
The Philippines ranks #2 in Asia for English proficiency, has strong American cultural affinity, graduates 500,000+ college students annually, offers $7-$15/hr rates delivering up to 80% savings, and has a 1.82-million-strong BPO workforce with $38.9 billion in annual revenue and proven infrastructure.
How fast is the virtual assistant market growing?
The VA services market is growing at a 22.4% CAGR, making it the fastest-growing outsourcing subsegment. The market is projected to grow from $19.6 billion in 2024 to $28-$32 billion in 2026 and $60-$70 billion by 2030, driven primarily by SMB accessibility.
What industries outsource the most?
Technology/SaaS leads at 82% adoption, followed by financial services (76%), healthcare (71%), e-commerce/retail (69%), and real estate (64%). Tech companies spend 18-25% of operating expenses on outsourcing, the highest share of any industry.
How do Philippines outsourcing rates compare to other countries?
Philippines rates ($7-$15/hr through VA Masters) offer the best value-to-quality ratio for English services. India is 10-20% cheaper but with accent and cultural trade-offs. Latin America costs 40-80% more. US-based alternatives cost 3-5x more. Quality-adjusted, the Philippines consistently delivers the highest ROI.
What outsourcing trends should businesses watch for 2026-2030?
Five key trends: AI augmentation becoming standard in outsourced roles, growth of outcome-based pricing, micro-outsourcing expanding accessibility, skills-based hiring replacing role-based hiring, and compliance/data security becoming competitive differentiators among providers.
Ready to Get Started?
Join 500+ businesses who trust VA Masters with their teams.
- No upfront payment required
- No setup fees
- Only pay when you are 100% satisfied with your VA

Anne is the Operations Manager at VA MASTERS, a boutique recruitment agency specializing in Filipino virtual assistants for global businesses. She leads the end-to-end recruitment process — from custom job briefs and skills testing to candidate delivery and ongoing VA management — and has personally overseen the placement of 1,000+ virtual assistants across industries including e-commerce, real estate, healthcare, fintech, digital marketing, and legal services.
With deep expertise in Philippine work culture, remote team integration, and business process optimization, Anne helps clients achieve up to 80% cost savings compared to local hiring while maintaining top-tier quality and performance.
Email: [email protected]
Telephone: +13127660301