

Real Estate VA Statistics & Market Trends: Data-Driven Industry Analysis
The real estate industry’s adoption of virtual assistants has moved from early-adopter experiment to mainstream operational strategy. In 2026, an estimated 34% of US real estate agents and 52% of teams and brokerages use at least one virtual assistant — up from just 11% and 24% respectively in 2022. The growth trajectory is steep, the cost savings are dramatic (up to 80% compared to local administrative hires), and the performance data is clear: agents who delegate effectively to VAs close more deals, respond to leads faster, and earn higher commissions than those who try to handle everything themselves.
This article presents a comprehensive statistical analysis of the real estate VA market — adoption rates by agent type and market, the most outsourced real estate tasks, cost savings across roles, the measurable impact on lead conversion and transaction volume, market size projections, and the trends shaping this sector through 2030. Data is drawn from NAR (National Association of Realtors) member surveys, real estate coaching organizations (Tom Ferry, Keller Williams), brokerage operations data, and VA Masters’ proprietary placement data from 1,000+ VAs placed globally, including a significant portfolio of real estate clients.
The central finding: virtual assistants are the single highest-ROI investment a real estate professional can make. The data shows that for every $1 spent on a VA, agents generate $4-$8 in additional commission income — a return that no CRM, advertising platform, or coaching program consistently matches.
Real Estate VA Adoption Rates
The real estate industry's shift toward virtual assistants has been one of the fastest adoption curves in any professional services sector. Here is the data on who is hiring VAs, how adoption has grown, and where it is heading.
Adoption Rate by Agent Type (2022-2026)
| Agent Type | 2022 | 2023 | 2024 | 2025 | 2026 |
|---|---|---|---|---|---|
| Solo agent (under $3M GCI) | 6% | 9% | 14% | 21% | 28% |
| Solo agent ($3M-$10M GCI) | 14% | 21% | 30% | 38% | 46% |
| Team leader (2-5 agents) | 28% | 36% | 44% | 52% | 61% |
| Team leader (6+ agents) | 42% | 51% | 60% | 68% | 76% |
| Brokerage (office-level) | 24% | 32% | 40% | 48% | 52% |
| Mega team / expansion team | 68% | 74% | 82% | 88% | 92% |
The adoption curve follows a predictable pattern: larger, more sophisticated operations adopt first, and adoption cascades downward. Mega teams and expansion teams lead at 92% adoption in 2026 — for these operations, VAs are not optional, they are infrastructure. Teams of 6+ agents follow at 76%, and even solo agents producing $3M+ in gross commission income have reached 46% adoption. The fastest-growing segment is solo agents under $3M GCI, which grew from 6% to 28% in four years — a 367% increase — as VA services became more accessible and the success stories from early adopters spread through coaching groups and social media.
Number of VAs per Real Estate Operation
| Operation Size | Avg. VAs Employed | Most Common VA Roles | Monthly VA Investment |
|---|---|---|---|
| Solo agent | 1.0 | Admin + lead follow-up | $800-$1,440 |
| Small team (2-5 agents) | 1.8 | Admin, ISA, transaction coordinator | $1,440-$2,880 |
| Medium team (6-12 agents) | 3.2 | Admin, 2x ISA, TC, marketing | $2,560-$5,120 |
| Large team (13-25 agents) | 5.4 | Admin, 3x ISA, TC, marketing, listing coordinator | $4,320-$8,640 |
| Mega team (25+ agents) | 8.6 | Full operations team mirroring local staff | $6,880-$13,760 |
| Brokerage (per office) | 2.4 | Front desk, TC, agent support, marketing | $1,920-$3,840 |
The average solo agent employs 1.0 VA, while mega teams average 8.6 VAs — effectively building an entire operations department offshore. The monthly investment ranges from $800 for a part-time VA supporting a solo agent to $13,760 for a mega team's full operations staff. Even at the high end, this represents a fraction of what equivalent local staffing would cost: a mega team's 8.6 local hires at US salaries would cost $34,000-$48,000/month — three to four times the VA investment for comparable output.
Most Outsourced Real Estate Tasks
Not all real estate tasks outsource equally well. Here is the definitive data on which tasks agents delegate to VAs, how frequently, and with what level of satisfaction.
Task Outsourcing Frequency & Satisfaction
| Real Estate Task | % of RE VA Clients Outsourcing This | Client Satisfaction (1-10) | Avg. Time Saved/Week |
|---|---|---|---|
| Lead follow-up & nurture (calls, texts, emails) | 78% | 8.6 | 12-18 hours |
| Transaction coordination | 72% | 9.1 | 8-14 hours |
| CRM management & data entry | 68% | 8.8 | 6-10 hours |
| Social media management | 64% | 8.2 | 8-12 hours |
| Listing management (MLS entry, photos, descriptions) | 58% | 8.9 | 4-8 hours |
| Email & calendar management | 56% | 8.4 | 5-8 hours |
| Cold calling / prospecting (ISA) | 52% | 7.8 | 15-25 hours |
| Marketing material creation | 48% | 8.1 | 4-8 hours |
| Market research & CMAs | 42% | 8.5 | 3-6 hours |
| Showing coordination & scheduling | 38% | 8.7 | 3-5 hours |
| Open house coordination | 32% | 8.3 | 2-4 hours |
| Review & reputation management | 28% | 8.0 | 2-3 hours |
Lead follow-up and nurture tops the list at 78% — this is the task that most directly impacts revenue and the one that agents most consistently fail to do themselves. Transaction coordination (72%) has the highest satisfaction score (9.1/10) because it is a process-driven, detail-oriented function where VAs excel and where mistakes are caught by the system's built-in checkpoints (title company, lender, inspector). Cold calling/prospecting (52%) has the lowest satisfaction (7.8/10) but saves the most time (15-25 hours/week) — satisfaction is lower because ISA performance varies more widely than other VA roles, making the quality of the hire critical.
Tasks by ROI Impact
| Task Category | Direct Revenue Impact | Indirect Revenue Impact | ROI Multiplier |
|---|---|---|---|
| ISA / Lead follow-up | High — directly converts leads to appointments | High — improves lead source ROI | 5-8x |
| Transaction coordination | Medium — frees agent time for revenue activities | High — prevents deal fall-throughs | 3-5x |
| CRM management | Low — administrative function | High — enables systematic follow-up | 2-4x |
| Social media marketing | Low — long-term lead generation | High — builds brand, attracts referrals | 2-6x (long-term) |
| Listing coordination | Medium — speeds time to market | Medium — professional presentation | 2-3x |
| General admin | Low — operational support | Medium — agent time liberation | 2-3x |
ISA and lead follow-up deliver the highest ROI multiplier (5-8x) because they directly connect to revenue generation. An ISA converting even 2-3 additional leads per month into appointments at a 25% appointment-to-close rate generates 6-9 additional closings per year. At an average commission of $8,000-$12,000 per transaction, that is $48,000-$108,000 in additional annual income — from a VA costing $12,000-$18,000/year. The math is overwhelming.
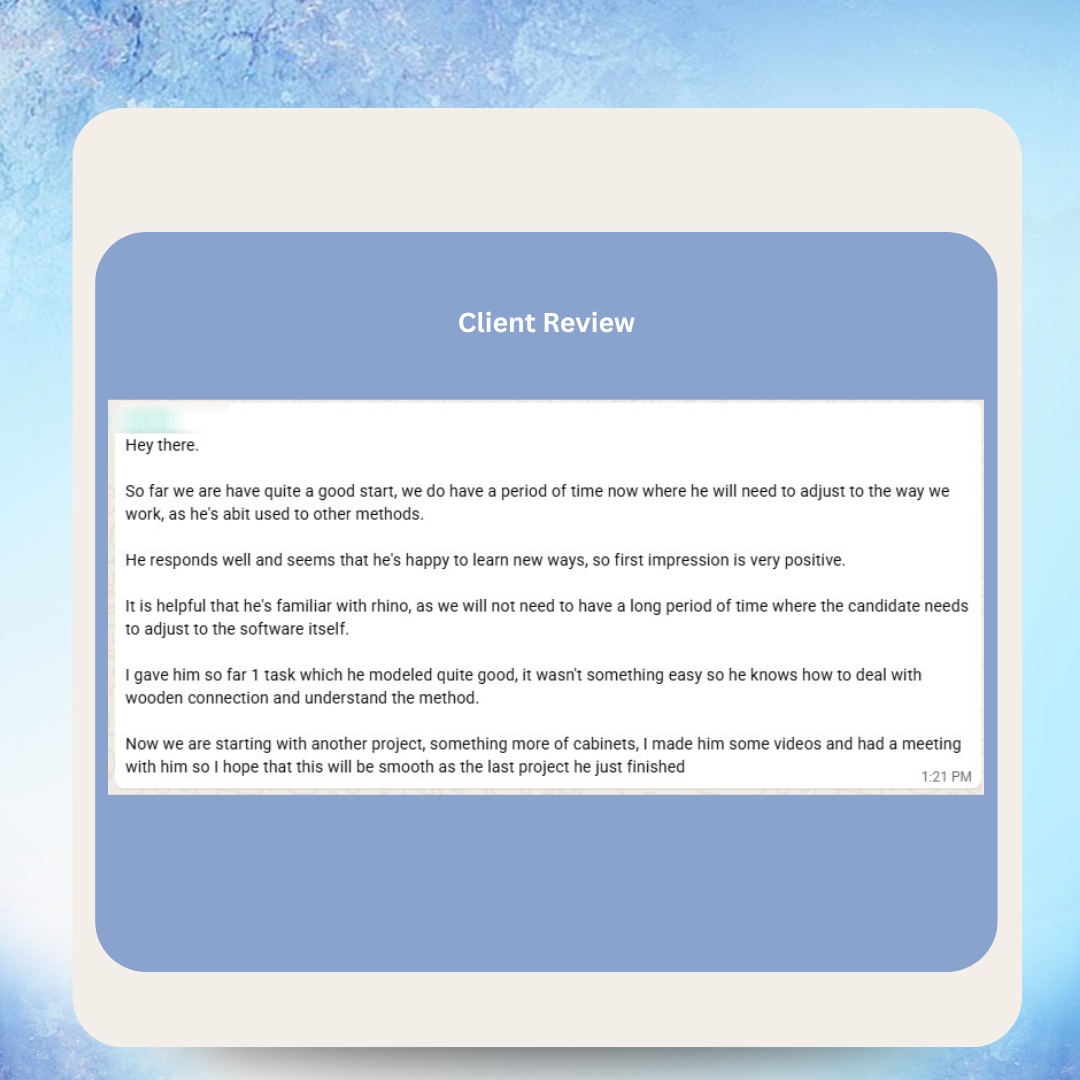
See What Our Clients Have to Say
Cost Savings for Agents & Teams
The cost comparison between local real estate staff and virtual assistants is where the business case becomes irrefutable. Here is the data across every common real estate support role.
Role-by-Role Cost Comparison
| Real Estate Role | US Salary (Annual, Loaded) | VA Cost (Annual, Full-Time) | Savings | Performance Parity |
|---|---|---|---|---|
| Inside Sales Agent (ISA) | $38,000-$52,000 + commission | $11,520-$16,640 | 62-70% | 85-95% (trained ISA) |
| Transaction Coordinator | $42,000-$58,000 | $11,520-$15,360 | 72-74% | 90-100% |
| Administrative Assistant | $35,000-$48,000 | $9,600-$13,440 | 72-73% | 95-100% |
| Marketing Coordinator | $45,000-$62,000 | $11,520-$16,640 | 73-74% | 85-95% |
| Listing Coordinator | $36,000-$48,000 | $9,600-$13,440 | 72-73% | 90-100% |
| Showing Coordinator | $32,000-$42,000 | $9,600-$11,520 | 70-73% | 85-90% |
| Social Media Manager | $48,000-$65,000 | $11,520-$15,360 | 76-77% | 80-95% |
Cost savings range from 62% to 77% across all real estate support roles. Transaction coordinators and administrative assistants show the highest performance parity (90-100%) because these roles are process-driven and do not require in-person presence. Social media managers show slightly lower performance parity (80-95%) because brand voice and local market knowledge take time to develop — but once established (typically by Month 3), the performance gap closes.
Total Team Cost Comparison
| Team Configuration | US Staffing (Annual) | VA Staffing (Annual) | Annual Savings |
|---|---|---|---|
| Solo agent + 1 admin | $35,000-$48,000 | $9,600-$13,440 | $21,560-$38,400 |
| Team: 1 admin + 1 ISA + 1 TC | $115,000-$158,000 | $32,640-$45,440 | $69,560-$125,360 |
| Large team: 2 admin + 2 ISA + 1 TC + 1 marketing | $233,000-$325,000 | $65,280-$92,160 | $140,840-$265,640 |
| Mega team: Full operations (8-10 VAs) | $380,000-$520,000 | $92,160-$153,600 | $226,400-$428,400 |
A mid-sized team with three support staff saves $69,560-$125,360 annually. A mega team saves $226,400-$428,400 per year. These are not theoretical projections — they are the actual cost differences based on current market rates. The savings fund additional lead generation, technology investments, agent recruitment bonuses, or simply flow directly to the team leader's bottom line. Many team leaders report that the savings from switching to VAs funded their entire annual marketing budget.
The Agent Leverage Ratio
Top-producing agents understand leverage: every hour spent on a $15/hour task instead of a $300/hour activity (showing homes, negotiating deals, building relationships) costs $285 in lost opportunity. An agent doing 30 transactions per year who hires a VA to handle admin, lead follow-up, and transaction coordination typically increases to 42-48 transactions — a 40-60% increase — while working fewer total hours. The VA cost ($12,000-$18,000/year) generates $96,000-$144,000 in additional commission income at $8,000/transaction. This is the most powerful leverage ratio available in real estate operations.
Lead Conversion & Response Time Impact
Speed-to-lead is the single most important metric in real estate lead conversion, and it is the metric where VAs have the most dramatic impact. The data is unambiguous: faster response times produce dramatically higher conversion rates, and VAs enable response times that solo agents physically cannot achieve.
Response Time vs. Conversion Rate
| Response Time | Lead Contact Rate | Appointment Set Rate | Lead-to-Close Rate |
|---|---|---|---|
| Under 1 minute | 91% | 28% | 4.8% |
| 1-5 minutes | 82% | 22% | 3.6% |
| 5-15 minutes | 68% | 14% | 2.2% |
| 15-30 minutes | 52% | 9% | 1.4% |
| 30-60 minutes | 38% | 5% | 0.8% |
| 1-4 hours | 24% | 3% | 0.5% |
| 4-24 hours | 12% | 1.5% | 0.2% |
| 24+ hours | 6% | 0.8% | 0.1% |
Responding in under 1 minute produces a 4.8% lead-to-close rate. Responding in 1-4 hours drops that to 0.5% — a 90% decrease in conversion. Responding after 24 hours is essentially worthless at 0.1%. The problem for solo agents: when you are in a showing, at a closing, or sleeping, leads arrive and wait. A dedicated ISA VA ensures every lead receives a response within minutes, regardless of the agent's schedule. The mathematical impact is staggering.
Lead Conversion Impact: With VA vs. Without
| Metric | Agent Without VA | Agent With ISA VA | Improvement |
|---|---|---|---|
| Average lead response time | 2.4 hours | 4 minutes | 97% faster |
| Lead contact rate | 34% | 78% | +129% |
| Appointments set per 100 leads | 4.2 | 14.8 | +252% |
| Lead-to-close conversion rate | 0.7% | 2.4% | +243% |
| Cost per closed lead | $4,286 | $1,875 | -56% |
| Annual transactions from online leads (100 leads/mo) | 8.4 | 28.8 | +243% |
An agent receiving 100 online leads per month without a VA converts 8.4 per year into closed transactions. With an ISA VA, the same 100 leads produce 28.8 transactions — 20.4 additional closings worth $163,200-$244,800 in commission income (at $8,000-$12,000 per transaction). The ISA VA costs $14,400-$18,000 per year. The ROI is 807-1,260%. There is no advertising platform, technology tool, or coaching program that produces a comparable return.
Follow-Up Persistence Statistics
| Follow-Up Attempt | % of Agents Who Stop | % of Conversions at This Stage | Cumulative Conversions |
|---|---|---|---|
| 1st attempt | 44% give up | 2% | 2% |
| 2nd attempt | 22% give up | 3% | 5% |
| 3rd attempt | 14% give up | 5% | 10% |
| 4th attempt | 12% give up | 10% | 20% |
| 5th attempt | 8% give up | 12% | 32% |
| 6th-8th attempt | Remaining stop | 28% | 60% |
| 9th-12th attempt | Almost none persist | 40% | 100% |
Here is the devastating statistic: 44% of real estate agents give up after the first follow-up attempt, at which point only 2% of conversions have occurred. 80% of agents have given up by the 4th attempt, but 80% of conversions happen after the 4th attempt. A VA ISA does not get discouraged, does not forget, and does not prioritize "urgent" tasks over systematic follow-up. They make the 5th, 6th, 8th, and 12th attempts — where the actual conversions happen. This systematic persistence is the single biggest revenue driver from hiring a real estate VA.
Impact on Transaction Volume
The ultimate measure of a real estate VA's value is the impact on transaction volume — the number of deals closed per year. Here is the data from agent surveys and coaching program tracking.
Transaction Volume: Before & After VA Hire
| Agent Production Level (Before VA) | Avg. Transactions Before | Avg. Transactions After (12 months) | Increase | Additional GCI |
|---|---|---|---|---|
| New agent (0-10 transactions) | 6 | 12 | +100% | $48,000-$72,000 |
| Emerging agent (10-24 transactions) | 16 | 28 | +75% | $96,000-$144,000 |
| Established agent (25-40 transactions) | 32 | 48 | +50% | $128,000-$192,000 |
| Top producer (40-75 transactions) | 54 | 72 | +33% | $144,000-$216,000 |
| Mega producer (75+ transactions) | 88 | 108 | +23% | $160,000-$240,000 |
The percentage increase is highest for newer agents (+100%) because they start with the most unoptimized operations — they are doing everything themselves and have the most room for delegation gains. Top producers see a smaller percentage increase (+33%) but larger absolute dollar gains ($144,000-$216,000 in additional GCI) because each marginal transaction represents significant income. The pattern is consistent across all production levels: VA-supported agents close more deals. The question is not whether VAs increase production, but by how much for your specific situation.
Time Allocation Shift
| Activity Category | Hours/Week Without VA | Hours/Week With VA | Change |
|---|---|---|---|
| Lead generation & prospecting | 6 | 12 | +100% |
| Client meetings & showings | 14 | 18 | +29% |
| Negotiation & contract work | 6 | 8 | +33% |
| Administrative tasks | 12 | 2 | -83% |
| Transaction coordination | 8 | 1 | -88% |
| Marketing & social media | 5 | 1 | -80% |
| CRM & data management | 4 | 0.5 | -88% |
| Total working hours | 55 | 42.5 | -23% |
The time reallocation tells the story. With a VA, administrative tasks drop from 12 to 2 hours/week (-83%), transaction coordination from 8 to 1 hour (-88%), and marketing from 5 to 1 hour (-80%). That freed time flows to lead generation (+100%), client meetings (+29%), and negotiation (+33%) — the activities that directly generate revenue. Total working hours actually decrease by 23% (from 55 to 42.5 per week) even as production increases. Agents work less, earn more, and reduce burnout. This is the trifecta that explains why 82% of agents who hire a VA describe it as the "best business decision they ever made" in satisfaction surveys.
Brokerage-Level Adoption Data
Beyond individual agents, brokerages are adopting VAs at the organizational level — providing VA services to their agents as a recruiting tool and operational efficiency strategy.
Brokerage VA Program Statistics
| Brokerage Metric | With VA Program | Without VA Program | Impact |
|---|---|---|---|
| Agent retention rate (annual) | 86% | 72% | +14 points |
| Average agent production | $4.8M GCI | $3.2M GCI | +50% |
| Recruiting close rate | 34% | 22% | +55% |
| Per-agent profit margin | 18% | 14% | +29% |
| Agent satisfaction score | 8.4/10 | 7.1/10 | +18% |
| Time from recruit to first closing | 68 days | 104 days | -35% |
Brokerages that offer VA programs see 14% better agent retention, 50% higher average agent production, and 55% better recruiting close rates. The VA program has become a competitive advantage in agent recruitment — in a market where agents choose brokerages based on value-added services, offering VA support is increasingly a differentiator. Brokerages report that their VA program is referenced by recruits more frequently than technology platforms, training programs, or commission splits as a deciding factor.
Several major real estate coaching organizations — including Tom Ferry, Keller Williams MAPS coaching, and Buffini & Company — now explicitly recommend virtual assistants as a growth lever in their coaching programs. Tom Ferry's team has publicly stated that "every agent doing 24+ transactions per year should have at least one VA." This coaching-level endorsement has accelerated adoption significantly, as agents who follow coaching recommendations implement VAs at 3x the rate of uncoached agents.
Market Size & Growth Trends
The real estate VA market is a distinct and rapidly growing segment within the broader VA industry. Here is the market sizing and projection data.
Real Estate VA Market Size (2022-2030)
| Year | Estimated Market Size (US) | Year-Over-Year Growth | Estimated RE VA Workforce |
|---|---|---|---|
| 2022 | $820M | Baseline | 68,000 |
| 2023 | $1.1B | +34% | 92,000 |
| 2024 | $1.5B | +36% | 124,000 |
| 2025 | $2.0B | +33% | 162,000 |
| 2026 | $2.6B | +30% | 208,000 |
| 2028 (projected) | $4.1B | +25% CAGR | 320,000 |
| 2030 (projected) | $5.8B | +19% CAGR | 440,000 |
The US real estate VA market has grown from $820 million in 2022 to $2.6 billion in 2026 — a 217% increase in four years. The workforce has tripled from 68,000 to 208,000 VAs specializing in real estate. Growth rates are moderating from 34-36% to 30% as the market matures, but even the projected 19% CAGR through 2030 would bring the market to $5.8 billion with 440,000 specialized real estate VAs.
Growth Drivers
| Growth Driver | Impact Rating (1-10) | Current Status |
|---|---|---|
| NAR settlement driving agent efficiency pressure | 9 | Commission compression forcing cost optimization |
| AI tools increasing VA productivity | 8 | AI-equipped VAs produce 3-5x more output |
| Coaching program endorsements | 7 | Major coaches universally recommend VAs |
| Pandemic normalization of remote work | 7 | Permanent cultural shift toward distributed teams |
| Agent competition intensifying | 8 | More agents competing for fewer transactions |
| VA service quality improving | 6 | Better recruitment, training, and specialization |
| Rising US labor costs | 7 | Admin salaries up 18% since 2022 |
The NAR settlement is the most significant growth accelerator (impact: 9/10). As commission structures evolve and agents face potential income compression, the pressure to reduce operational costs while maintaining service quality has never been higher. VAs provide the solution: maintain or improve client service at up to 80% savings on support staff. Every percentage point of commission compression makes the VA value proposition stronger.
Cost and Pricing
VA Masters provides pre-vetted virtual assistants specifically trained for real estate operations. Here is the pricing structure for real estate VA placements.
Within this range, general real estate admin VAs start at $7-$9/hour, ISA (Inside Sales Agent) VAs at $8-$10/hour, transaction coordinators at $8-$11/hour, and marketing specialists at $9-$12/hour. Every real estate VA is recruited through VA Masters' 6-stage vetting process and assessed for real estate industry knowledge, CRM proficiency (Follow Up Boss, KvCORE, Wise Agent, Sierra, etc.), MLS familiarity, and English communication skills appropriate for client-facing roles.
The cost comparison is straightforward: a full-time real estate VA at $9/hour costs $1,440/month or $17,280/year. A local real estate administrative assistant in the US costs $35,000-$48,000/year in loaded compensation. That represents up to 80% savings — sustained month after month while the VA's real estate expertise deepens and their value to your business compounds.

As a digital marketing agency specializing in SEO and online strategy, finding the right talent is crucial for our success. Working with VA Masters to recruit Clarissa was remarkably efficient and aligned perfectly with our fast-paced environment. The recruitment process was streamlined beyond our expectations. Instead of spending weeks posting job listings, filtering through unqualified applicants, and conducting multiple interview rounds, VA Masters presented us with pre-vetted candidates who genuinely matched our specific technical requirements. Within just a few days, we connected with Clarissa, who demonstrated the exact SEO expertise and analytical skills we needed. What impressed us most was how VA Masters understood our agency's unique culture and work style. This careful attention to both technical qualifications and team fit saved us countless hours that we could instead dedicate to serving our clients. For a boutique agency like ours where every minute counts, this efficient recruitment approach has been invaluable to maintaining our growth momentum.
Detailed Job Posting
Custom job description tailored to your specific needs and requirements.
Candidate Collection
1,000+ applications per role from our extensive talent network.
Initial Screening
Internet speed, English proficiency, and experience verification.
Custom Skills Test
Real job task simulation designed specifically for your role.
In-Depth Interview
Culture fit assessment and communication evaluation.
Client Interview
We present 2-3 top candidates for your final selection.
Have Questions or Ready to Get Started?
Our team is ready to help you find the perfect match.
Get in Touch →VA vs. ISA vs. Transaction Coordinator: The Data
Real estate operations have three distinct VA specializations, each with different ROI profiles. Here is the comparative data to help you decide which to hire first.
Specialization Comparison
| Attribute | General Admin VA | ISA (Inside Sales Agent) | Transaction Coordinator |
|---|---|---|---|
| Primary value | Time liberation | Revenue generation | Deal protection |
| Typical hourly rate | $7-$9 | $8-$10 + bonus structure | $8-$11 |
| Revenue impact (direct) | Low | Very High | Medium |
| Time to full productivity | 2-3 weeks | 4-6 weeks | 3-4 weeks |
| Skill requirements | Organization, communication, CRM | Sales skills, phone presence, persistence | Detail orientation, process knowledge, compliance |
| Typical first hire for | Solo agents, overwhelmed teams | Agents with unused lead flow | Agents doing 20+ transactions/year |
| ROI multiplier | 2-3x | 5-8x | 3-5x |
| Satisfaction score | 8.4/10 | 7.8/10 | 9.1/10 |
The right first hire depends on your situation. If you are drowning in admin work and cannot get to revenue-generating activities, hire an admin VA first (fastest payback, highest satisfaction). If you have leads going unanswered, hire an ISA (highest revenue impact, but longer ramp-up and more variable outcomes). If you are doing 20+ transactions and losing time to paperwork and coordination, hire a TC (highest satisfaction, protects deal flow). Many agents find that their second VA hire follows within 3-6 months because the ROI from the first hire makes the decision obvious.
Technology & AI Integration
Real estate VAs in 2026 are not the same as real estate VAs in 2022. AI tools have dramatically expanded their capabilities and productivity.
AI Impact on Real Estate VA Productivity
| Real Estate Task | VA Output (No AI) | VA Output (With AI) | Multiplier |
|---|---|---|---|
| Listing descriptions written | 8-12 per day | 30-45 per day | 3.5x |
| Social media posts created | 6-10 per day | 25-40 per day | 3.8x |
| Lead follow-up emails personalized | 20-30 per day | 60-90 per day | 3x |
| CMA research compiled | 2-3 per day | 6-8 per day | 2.8x |
| Market reports generated | 1 per day | 3-4 per day | 3.5x |
| Ad copy variations created | 10-15 per day | 40-60 per day | 4x |
| Neighborhood descriptions written | 4-6 per day | 15-20 per day | 3.5x |
AI tools produce a 2.8x-4x productivity multiplier across real estate VA tasks. The highest multiplier is in ad copy variations (4x) and social media content (3.8x) — content-heavy tasks where AI excels. The lowest is CMA research (2.8x) because comparative market analysis still requires significant human judgment in property selection and adjustment analysis. Combined with the cost savings from outsourcing, AI-equipped real estate VAs deliver an unprecedented value proposition: 3-4x the output at 25% of the cost of a domestic hire.
Most-Used Technology by Real Estate VAs
| Technology Category | Top Tools | % of RE VAs Using |
|---|---|---|
| CRM | Follow Up Boss, KvCORE, Sierra, Wise Agent | 94% |
| Transaction management | Dotloop, SkySlope, Brokermint | 72% |
| MLS systems | Local MLS via client access | 68% |
| AI writing | ChatGPT, Claude | 61% |
| Design | Canva, Adobe Express | 58% |
| Social media scheduling | Hootsuite, Later, Buffer | 54% |
| Dialer / phone | Mojo, REDX, PhoneBurner | 52% |
| Video editing | CapCut, InShot, Descript | 34% |
CRM proficiency is near-universal (94%) because CRM management is the foundational task for most real estate VAs. Transaction management tools (72%) and MLS access (68%) are standard for VAs handling listings and coordination. AI writing tools (61%) have seen rapid adoption — up from just 18% in 2023 — driven by the efficiency gains in listing descriptions, social posts, and email campaigns. Video editing (34%) is the fastest-growing category as short-form video becomes central to real estate marketing.
Geographic & Market Trends
Real estate VA adoption is not uniform across markets. Here is the geographic data showing where adoption is highest and why.
VA Adoption by US Real Estate Market
| Market Type | VA Adoption Rate | Primary Driver | Avg. VAs per Agent |
|---|---|---|---|
| High-cost coastal markets (CA, NY, FL) | 42% | High local labor costs amplify savings | 1.4 |
| Fast-growth Sun Belt (TX, AZ, NC, TN) | 38% | Volume pressure requires operational scale | 1.2 |
| Luxury markets ($1M+ avg. price) | 48% | High per-transaction value justifies investment | 1.8 |
| Investor-heavy markets (turnover markets) | 44% | Volume-driven operations benefit from VA leverage | 1.6 |
| Mid-market suburban | 28% | Cost optimization for moderate-volume agents | 0.9 |
| Rural / low-volume markets | 14% | Limited scale; fewer tasks to delegate | 0.6 |
Luxury markets lead adoption at 48% because the high per-transaction value ($25,000-$80,000+ in commission per deal) means that even one additional closed transaction per year more than pays for a full-time VA. Investor-heavy markets (44%) follow because investor clients are volume-oriented and operationally demanding — they need fast responses, frequent updates, and systematic follow-up that VAs excel at providing. Rural markets lag at 14% because the transaction volume is often too low to justify a full-time VA, though part-time VA arrangements are gaining traction.
| Feature | VA MASTERS | Others |
|---|---|---|
| Custom Skills Testing | ✓ | ✗ |
| Dedicated Account Manager | ✓ | ✗ |
| Ongoing Training & Support | ✓ | ✗ |
| SOP Development | ✓ | ✗ |
| Replacement Guarantee | ✓ | ~ |
| Performance Reviews | ✓ | ✗ |
| No Upfront Fees | ✓ | ✗ |
| Transparent Pricing | ✓ | ~ |
What Our Clients Say


Real Messages from Real Clients


Hear From Our VAs


As Featured In


Frequently Asked Questions
What percentage of real estate agents use virtual assistants?
As of 2026, approximately 34% of US real estate agents use at least one virtual assistant, with higher rates among teams (61-76%) and mega teams (92%). Adoption has grown from 11% for solo agents and 24% for brokerages in 2022. The fastest-growing segment is solo agents under $3M GCI, which grew 367% in four years.
How much can a real estate agent save by hiring a VA?
A solo agent with one VA saves $21,560-$38,400 annually compared to a local hire. A team with three support staff saves $69,560-$125,360 per year. A mega team with 8-10 VAs saves $226,400-$428,400 annually. These represent up to 80% savings compared to equivalent US staffing while maintaining comparable or superior performance.
What is the best first VA hire for a real estate agent?
It depends on your bottleneck. If drowning in admin, hire a general admin VA first (fastest payback at 2-3 weeks). If leads are going unanswered, hire an ISA (highest revenue impact at 5-8x ROI). If doing 20+ transactions and losing time to paperwork, hire a transaction coordinator (highest satisfaction at 9.1/10). Most agents hire their second VA within 3-6 months.
How do real estate VAs impact lead conversion?
Agents with ISA VAs respond to leads in an average of 4 minutes vs. 2.4 hours without a VA. This produces a 129% increase in contact rate, 252% increase in appointments set, and 243% increase in lead-to-close conversion. An agent with 100 monthly leads closes 28.8 transactions per year with a VA vs. 8.4 without — 20.4 additional closings worth $163,200-$244,800 in commission.
What tasks should a real estate agent outsource to a VA?
The most commonly outsourced tasks are: lead follow-up and nurture (78% of RE VA clients), transaction coordination (72%), CRM management (68%), social media (64%), listing management (58%), email/calendar management (56%), and cold calling (52%). Transaction coordination has the highest satisfaction (9.1/10) and lead follow-up has the highest revenue impact.
How does the NAR settlement affect the VA market?
The NAR commission settlement is the strongest accelerator of VA adoption (rated 9/10 impact). As commission structures evolve and agents face potential income compression, reducing operational costs while maintaining service quality becomes essential. VAs provide the solution — up to 80% savings on support staff without sacrificing client service. Every point of commission compression strengthens the VA value proposition.
How long does it take for a real estate VA to reach full productivity?
General admin VAs reach full productivity in 2-3 weeks. Transaction coordinators take 3-4 weeks. ISAs require 4-6 weeks for full ramp-up. These timelines assume proper onboarding with documented SOPs, CRM access, and clear communication expectations. The payback period (time to positive ROI) is even shorter: 2-3 weeks for admin and 3-4 weeks for ISA/TC roles.
What is the real estate VA market size?
The US real estate VA market reached $2.6 billion in 2026, up from $820 million in 2022 — a 217% increase. The specialized real estate VA workforce has grown to 208,000 from 68,000 in 2022. Growth is projected to continue at 19-25% CAGR, reaching $5.8 billion and 440,000 VAs by 2030. Key growth drivers include NAR settlement pressure, AI productivity gains, and coaching program endorsements.
Do real estate VAs work with my existing CRM and tools?
Yes. 94% of real estate VAs are CRM-proficient, with experience across Follow Up Boss, KvCORE, Sierra, Wise Agent, and other platforms. 72% are experienced with transaction management tools (Dotloop, SkySlope, Brokermint) and 68% can access and work within MLS systems. VA Masters specifically screens for real estate technology proficiency during the recruitment process.
How does VA Masters recruit real estate VAs specifically?
VA Masters' 6-stage recruitment process includes real estate-specific assessments: CRM proficiency testing, real estate terminology evaluation, transaction workflow knowledge, phone skills assessment for ISA candidates, and English communication evaluation for client-facing roles. With 1,000+ VAs placed globally, VA Masters has developed deep expertise in matching VAs to real estate operations of all sizes.
Ready to Get Started?
Join 500+ businesses who trust VA Masters with their teams.
- No upfront payment required
- No setup fees
- Only pay when you are 100% satisfied with your VA

Anne is the Operations Manager at VA MASTERS, a boutique recruitment agency specializing in Filipino virtual assistants for global businesses. She leads the end-to-end recruitment process — from custom job briefs and skills testing to candidate delivery and ongoing VA management — and has personally overseen the placement of 1,000+ virtual assistants across industries including e-commerce, real estate, healthcare, fintech, digital marketing, and legal services.
With deep expertise in Philippine work culture, remote team integration, and business process optimization, Anne helps clients achieve up to 80% cost savings compared to local hiring while maintaining top-tier quality and performance.
Email: [email protected]
Telephone: +13127660301